


Click the button to start reading
See It in Action: How to Create and Use S-Curves in Project Management
Wanna enjoy the ride to project success?
Discover the tool that helps you spot the twists, turns, and potential bottlenecks every step of the way.
Join us as we explore what an S-curve is and how to use it in project management. Along the way, you’ll find quick examples and advanced tips to get started.
Let’s dive in!
What Is an S-Curve in Project Management?
An S-curve is a term for a graph that shows how a project is progressing over time. It helps you visualize this journey, showing you where you started, how far you’ve come, and how close you are to the finish line.
S-curves can be used in any type of project, no matter how big or small. They’re flexible and adaptable to different industries and sectors. Obviously, this makes them useful for tracking progress and continuously improving projects.
Why an S?
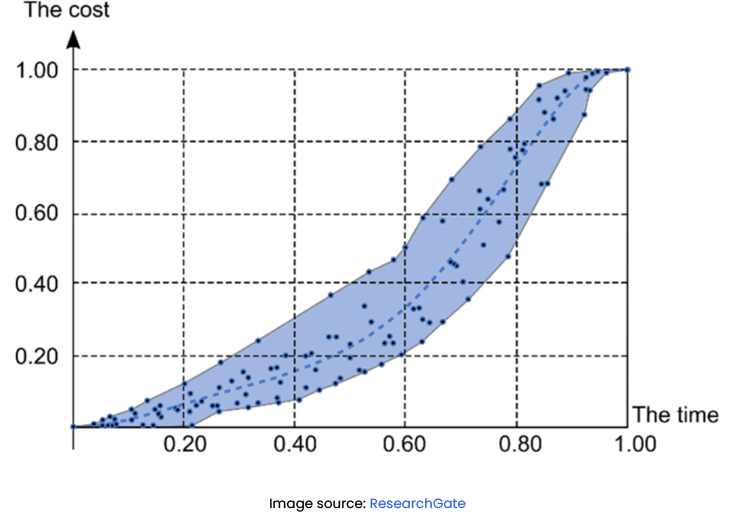
It’s called an S-curve because it looks like the letter “S” when you plot your project’s data points on a graph.
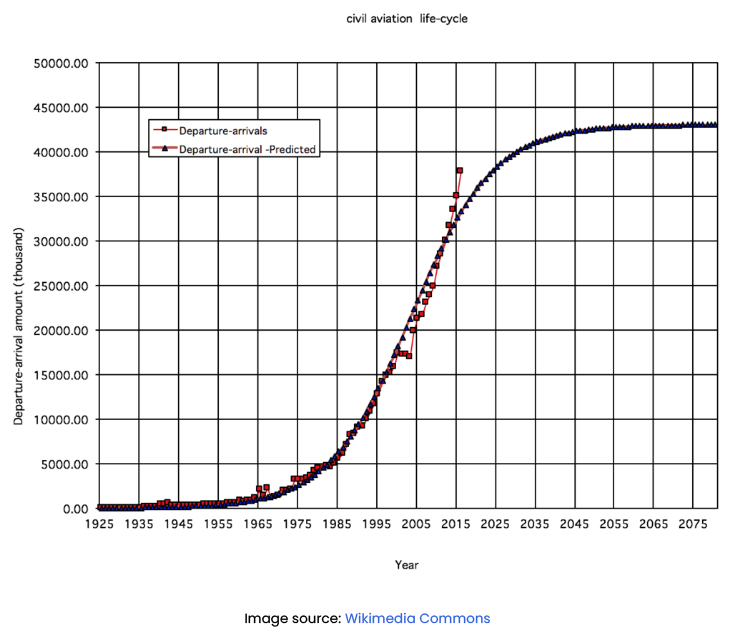
Take this sample graph for illustration:
The S-curve is also referred to as the “sigmoid curve”. The term “sigmoid” comes from the Greek word “sigma,” which means “S-shaped.” By the way, the sigmoid curve is a mathematical function. It shares a similar shape to the S-curve, with gradual growth, acceleration, and eventual leveling off.
What Does an S-Curve Graph Show?
An S-curve in project management shows what was planned and helps to compare it with what actually happened. Here’s what the S-curve depicts:
Time: On the graph, you have a horizontal line that represents time. It could be weeks, months, or whatever time units you’re using for your project.
Progress: Then, you have a vertical line that represents progress. It could be things like the work completed, the money spent, or any other measure of progress you want to track.
Planned Curve: You start by drawing a line that shows how you planned the project to progress over time. This line represents your initial estimates and expectations.
Actual Curve: As your project unfolds, you collect real data and plot it on the graph. This shows how your project is actually progressing compared to the plan.
Below you see the area of the S-curve of budgeted costs. It indicates the portion of the S-curve that represents the total planned costs for the project.
S-Curve in Project Management: How It Works
Now, let’s see a quick example of how an s-curve works:
Getting Started: Imagine you’re starting a project. At the beginning, the S-curve starts with a gentle slope. This means progress is a bit slower because you’re setting things up and getting organized.
Picking Up Speed: As your project gains momentum, the S-curve starts to go up more steeply. This is the exciting part where things really start moving! You’re completing tasks, hitting milestones, and making progress.
Reaching the Peak: The S-curve reaches its highest point when progress is at its maximum. This is when you’re firing on all cylinders and reaching milestones right on schedule. Your actual progress should be closely aligned with your plan during this peak phase.
Slowing Down: After reaching the peak, the S-curve starts to level off. Progress becomes a bit slower. It’s like taking a breather after a sprint! This could be because you’ve finished big tasks or run into unexpected challenges. During this phase, your actual progress might be a bit behind your plan.
Finishing Strong: The S-curve approaches a plateau as the project nears completion. Progress slows down even more as you wrap up the final tasks. It’s like crossing the finish line with a big smile!
Common Uses of the S-Curve in Project Management
You may wonder why you should use S-curves in project management. Well, take these statistics.
Typically, big IT projects go over budget by about 45% and take longer than expected. What’s more, they end up delivering only 56% of the value originally predicted.
But the good news is – you can steer clear of the common setbacks that lead to poor project outcomes. In fact, an S-curve tells you a lot about your project. Next, let’s discover how the S-curve is used in project management.
Spotting Deviations
You can compare the planned curve with the actual curve to find any differences or changes in project progress. If your actual progress consistently falls below the planned curve, it’s a sign that something might be off-track. It could be delays or issues you need to address.
Communicating with Stakeholders
S-curves are great for sharing project progress with stakeholders. So, are things going well? Are there any challenges to overcome? These graphs provide a clear visual representation that everyone can understand. You can share them in reports, presentations, or meetings to keep stakeholders in the loop.
Dealing with Risks
If the actual curve deviates from the planned curve, be attentive. It may indicate underlying issues or risks that need to be addressed. By keeping an eye on the S-curve in project management, you can spot warning signs early and make decisions to mitigate risks.
Planning for the Future
The S-curve helps with forecasting and planning. Here’s how. You can extend the curve into the future and estimate the project’s completion and resource needs. This will help you make decisions about project timelines, resources, and stakeholder expectations.

Creating an S-Curve: What Do You Need to Make an S-Curve?
Making an S-curve is as easy as plotting points on a graph. You take the planned progress and the actual progress of the project and plot them against time.
Here’re the prerequisites you’ll need in place.
Project Schedule: You need a clear plan that shows what needs to be done and when.
Work Breakdown Structure (WBS): Next, you need to break down the project into smaller tasks with specific start and end dates. This helps track progress and generate accurate S-curves.
Baseline Plan: Set a starting point for your project by creating a baseline plan that represents the original schedule. It helps compare actual progress to the planned curve.
Data Collection: Collect information on completed tasks and the percentage of work done for ongoing tasks. This data is crucial for creating meaningful S-curves.
Regular Updates: Provide regular updates on completed tasks and the percentage of work done. This ensures the S-curves reflect the actual progress.

Mastering S-Curves in Project Management: Advanced Tips and Expert Advice.
Keep Your Baseline Updated
As your project progresses, make sure to review and update your baseline regularly. For example, adjust the planned curve to reflect any changes in the project’s scope, schedule, or resource allocation. If you keep your baseline up to date, your S-curve will remain a reliable reference point for tracking performance.
Combine S-Curves with Earned Value Management
Consider using Earned Value Management (EVM) alongside S-curves for a more comprehensive analysis. EVM combines cost, schedule, and work performance data to give you a well-rounded view of project progress. By integrating EVM metrics with S-curves, you can gain deeper insights into a number of metrics. For example, you’ll be able to estimate completion dates and monitor project performance.
Use S-Curves as an Early Warning System
S-curves can act as an early warning system for project risks or performance issues. By comparing the actual curve with the planned curve, you can spot patterns that indicate potential problems. Use this information to take timely corrective actions. Plus, adjust project plans and mitigate risks before they become significant issues.
Integrate S-Curves with Other Tools
Combine S-curves with other project management tools and techniques to enhance their effectiveness. For example, integrate S-curves with different scheduling methods or Monte Carlo simulations. This will allow you to manage project risks, track critical activities, and schedule for uncertainties.
Use Advanced Reporting and Visualization
Need to share information about project progress and information? Explore visualization techniques to present S-curves in a more meaningful way. Use dashboards, interactive charts, and graphical representations to get your message through faster.
Compare Different Scenarios
Make several S-curves for different project situations. Try alternative schedules or resource plans. Eventually, see how choices affect project performance and make smarter decisions.
Use Tools to Create Graphs for Your Project
Microsoft Excel is a widely available and easy-to-use tool for creating S-curves. You can create a simple graph by plotting your planned and actual data points against time. If you prefer a cloud-based solution, Google Sheets is another free and user-friendly tool.
Besides, many project management software tools include built-in features for creating various graphs. All-in-one platforms, such as Teamly, can help you generate templates and graphs based on your project data. Alternatively, you can check for integrations with third-party apps that allow you to create S-curves on the platform you’re using now.
Conclusion
To sum up, with S-curves, you can stay one step ahead, spot deviations, and make smart decisions. Say goodbye to project headaches and hello to streamlined success. Use S-curves in project management and let them guide you towards project triumph with ease!